Despite a global decline in foreign direct investment to developing countries in 2024, Norfund committed NOK 7.7 billion — an 18 percent increase from 2023 and our highest annual investment to date.
The figures below, and more, are explained in more detail on the relevant pages of the annual report.
Commitments
New in 2024
Total portfolio
Mobilization and costs
2024
mobilized private capital*
2024
operating costs of committed portfolio
*attributed according to OECD Methodology
Investments
New
Follow-ons
Companies in portfolio
Direct investees
Indirect investees
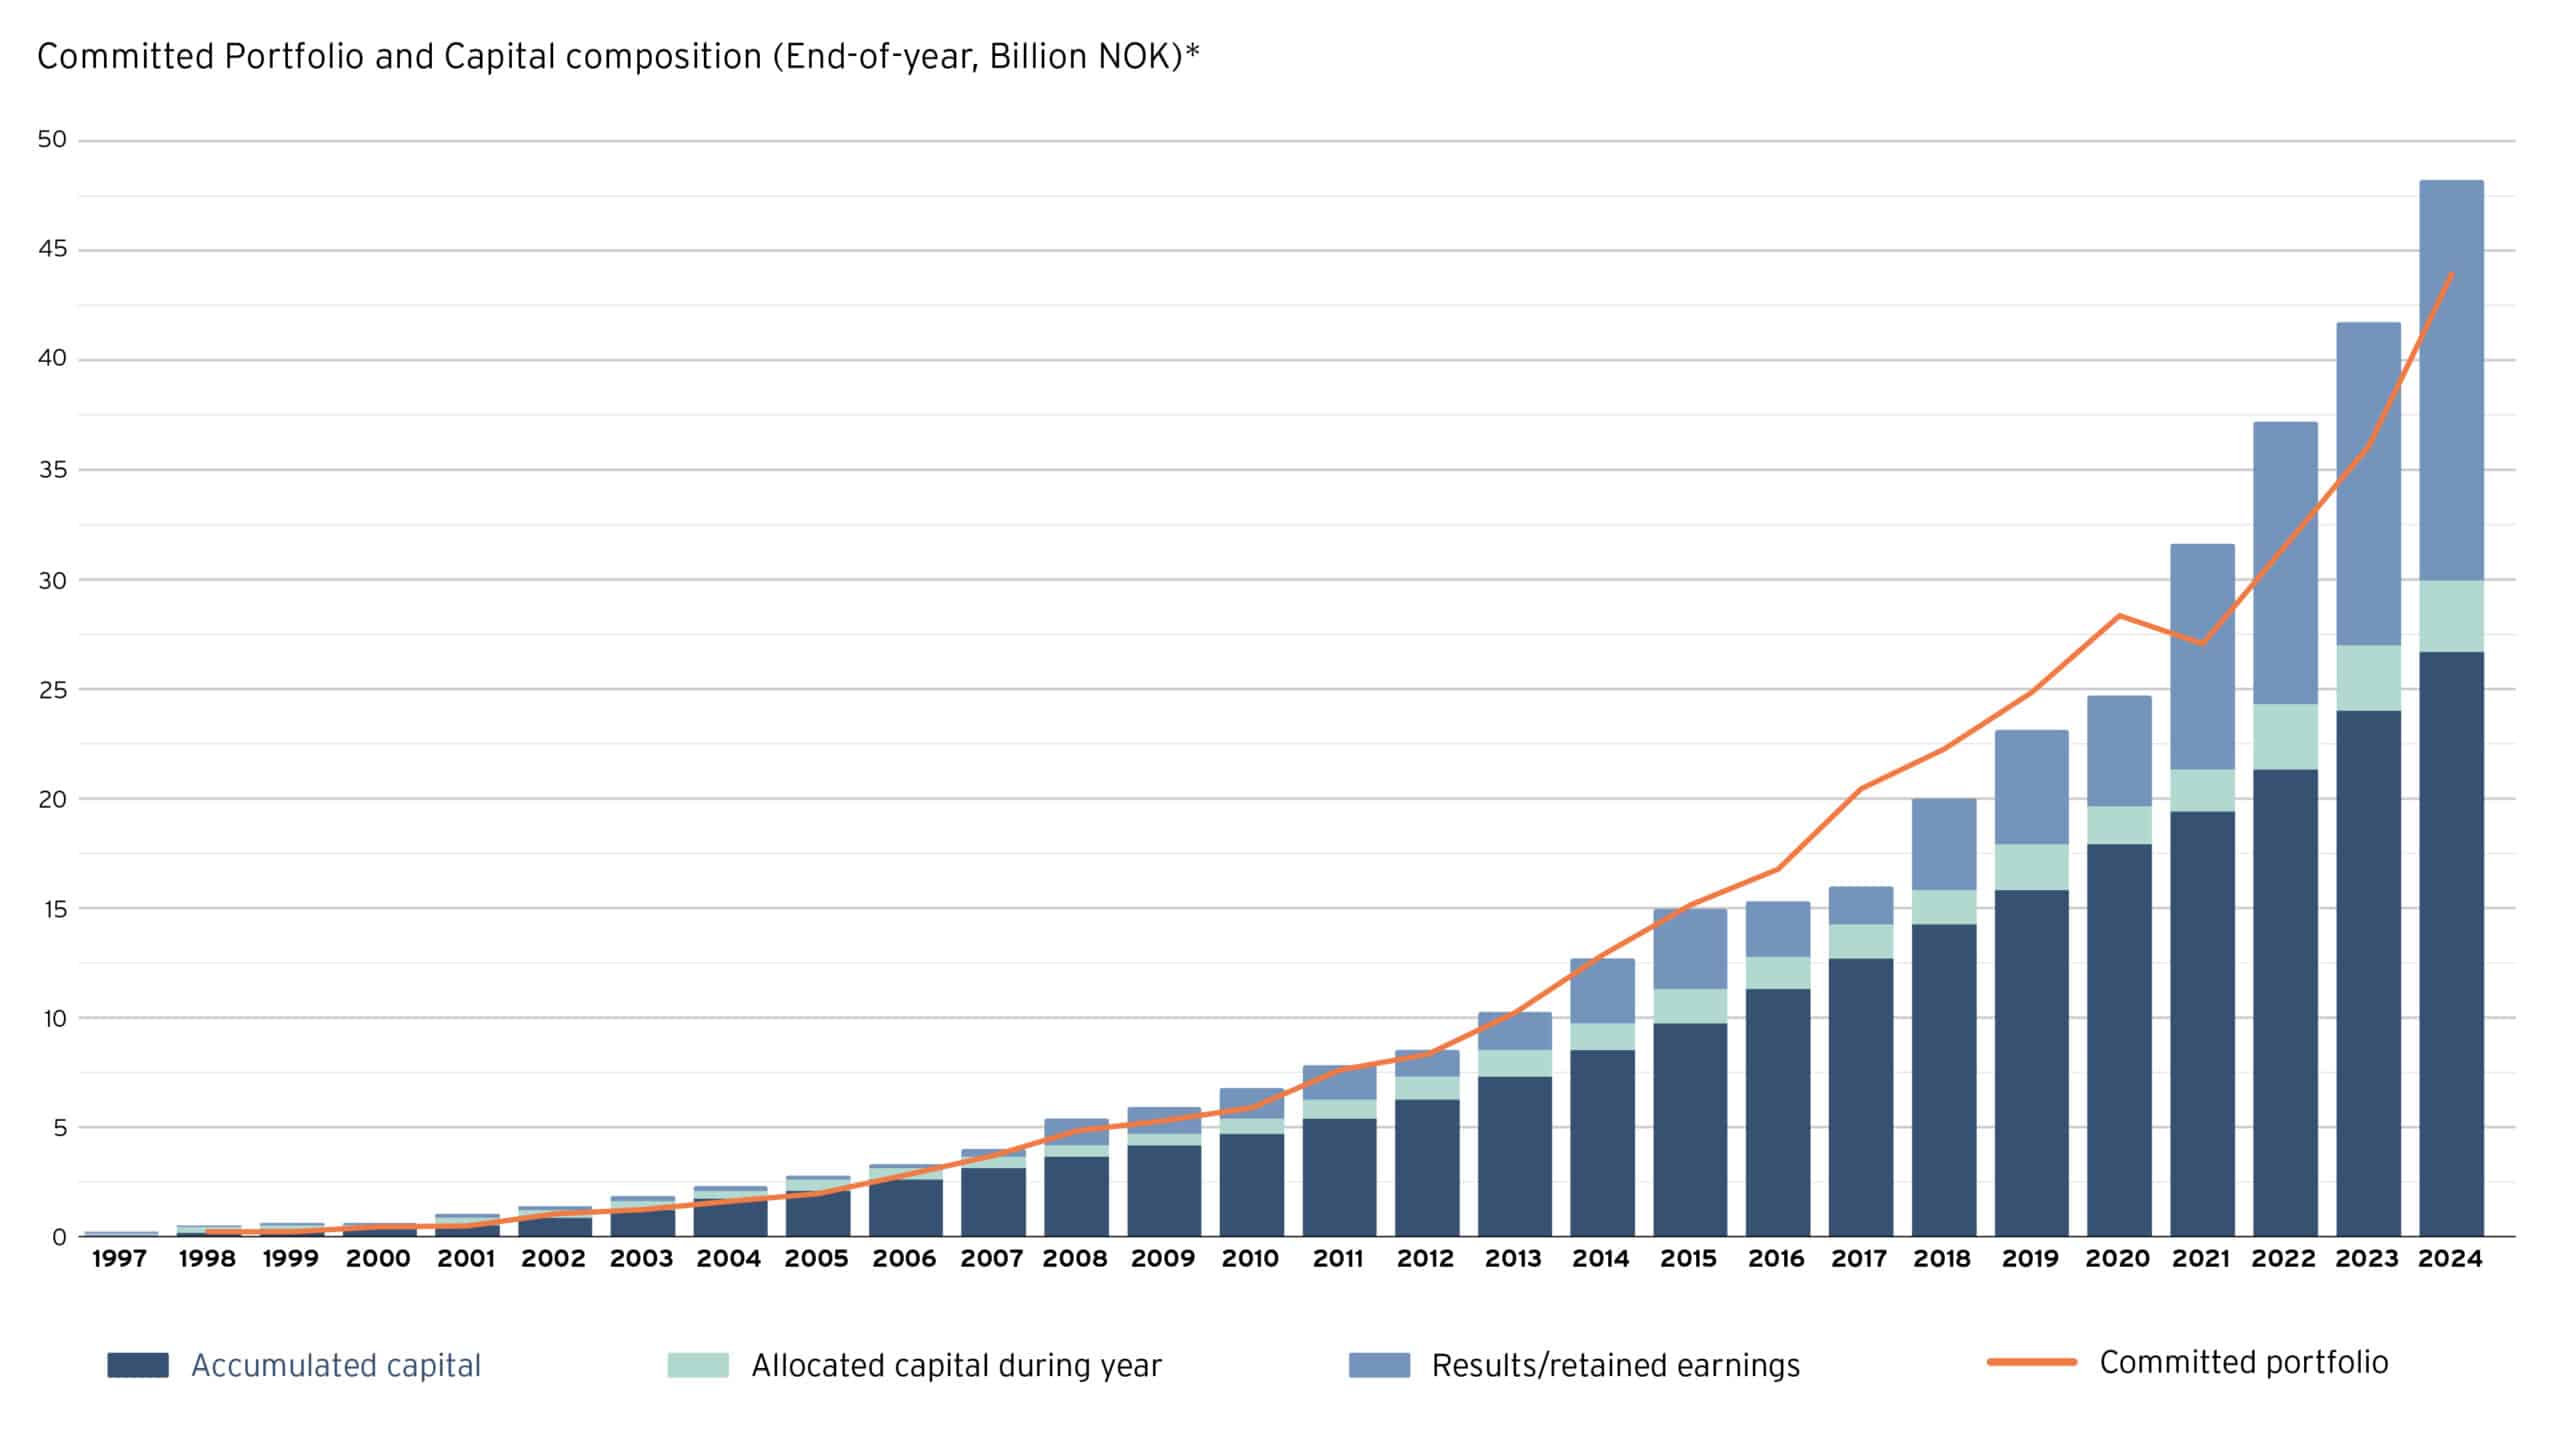
Committed investments per year (MNOK)
Jobs
Jobs
in portfolio companies
Jobs created
net, in portfolio companies
Female employees
in portfolio companies
Avoided emissions
2024
actual tCO2e avoided emissions in 2024 from portfolio companies (greenfield)
Since inception
expected tCO2e avoided emissions annually
Climate Investment Fund
Energy access and supply
New households
granted access to electricity via micro/minigrids or solar home systems
Electricity produced
by portfolio companies in 2024
New capacity
total new renewable capacity financed
Access to finance
New clients
offered financial services in 2024
Total clients
offered financial services in 2024
Increased lending
increase in total lending volume
Internal rate of return
2024
in investment currency (19.6% in NOK)
Since inception
in investment currency (8.7% in NOK)
Development mandate
in investment currency in 2024 (19.7% in NOK)
Climate mandate
in investment currency in 2024 (18.2% in NOK)
Commitments per investment area
Total portfolio (MNOK)
In 2024 (MNOK)
Commitments per region
Total portfolio (MNOK)
In 2024 (MNOK)
Portfolio since inception
Norfund Key Performance Indicators
Development Mandate
Four key performance indicators (KPIs) have been developed to ensure that the portfolio evolves in line with Norfund's mandate. While the KPIs are measured at the portfolio level, they are also monitored annually (see table below).
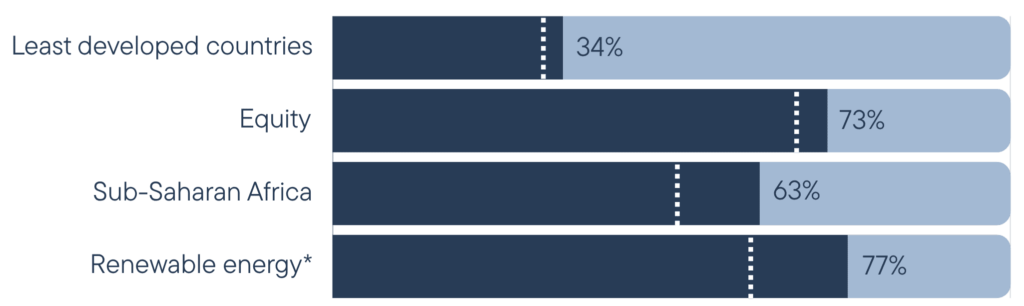
*The RE KPI was new for 2022 and is different from the other portfolio KPI’s. The RE KPI is defined as total RE-commitments (at commitment date fx-rate) divided by total allocation from MFA, starting from 2022. This should over time be at least 60%.
Gender equality in Norfund's investees 2024
Gender equality in Norfund 2024
Key figures per year
| Key figures | 2016 | 2017 | 2018 | 2019 | 2020 | 2021 | 2022 | 2023 | 2024 |
|---|---|---|---|---|---|---|---|---|---|
| Climate and Development Mandates | |||||||||
| Committed portfolio (MNOK) | 16 762 | 20 439 | 22 253 | 24 944 | 28 352 | 26 924 | 31 650 | 36 225 | 43 225 |
| New investments (MNOK) | 2 784 | 3 600 | 3 511 | 4 015 | 4 839 | 5 320 | 6 513 | 6 487 | 7694 |
| Number of direct investments in portfolio | 124 | 136 | 149 | 163 | 170 | 198 | 226 | 230 | 245 |
| Capital allocated by the owner (MNOK) | 1 478 | 1 500 | 1 690 | 1 905 | 1 820 | 1 680 | 2678 | 2 678 | 2938 |
| Number of employees in Norfund | 69 | 71 | 75 | 82 | 96 | 111 | 113 | 134 | 149 |
| Development Mandate | |||||||||
| Committed portfolio (MNOK) | 16 762 | 20 439 | 22 253 | 24 944 | 28 352 | 26 924 | 29 516 | 32 468 | 37 636 |
| New investments (MNOK) | 2 784 | 3 600 | 3 511 | 4 015 | 4 839 | 5 320 | 4 540 | 4 873 | 6016 |
| Return on invested capital (IRR) (inv. currency)* | 2.9% | 14% | 4.6% | 6.3% | -0.1% | 5.2% | 5.1% | 1.8% | 8.3% |
| Number of direct investments in portfolio | 124 | 136 | 149 | 163 | 170 | 195 | 219 | 219 | 230 |
| KPI: Share of investments in least developed countries | 33% | 36% | 41% | 40% | 39% | 40% | 37% | 38% | 33.6% |
| KPI: Share of investments in Sub Saharan Africa | 52% | 50% | 55% | 53% | 53% | 65% | 63% | 64% | 62.6% |
| KPI: Share of equity and indirect equity | 85% | 85% | 81% | 79% | 79% | 75% | 74% | 71% | 72.6% |
| KPI: Renewable energy share of allocated capital >50% (ended 2021) | 62% | 145% | 60% | 55% | 54% | 40% | - | - | - |
| KPI: Renewable energy share of allocated capital >60% | 64% | 68% | 77.5% | ||||||
| Number of jobs in portfolio companies | 276 000 | 292 000 | 304 000 | 380 000 | 377 000 | 452 000 | 514 000 | 625 000 | 712 000 |
| Taxes paid by portfolio companies (BNOK) | 10.9 | 9.3 | 13.9 | 14.1 | 16.9 | 16.9 | 23.2 | 33 | 41 |
| Climate Mandate | |||||||||
| Committed portfolio (MNOK) | - | - | - | - | - | - | 2 135 | 3 757 | 5589 |
| New investments (MNOK) | - | - | - | - | - | - | 2135 | 1 614 | 1678 |
| Number of direct investments in portfolio | - | - | - | - | - | - | 7 | 12 | 16 |