New commitments
billion NOK in 2020*
*Excluding Business Support and PDRMF
Total committments
billion NOK in portfolio
Investments
new / follow-on investments in 2020
Companies
total direct/indirect investees in the portfolio
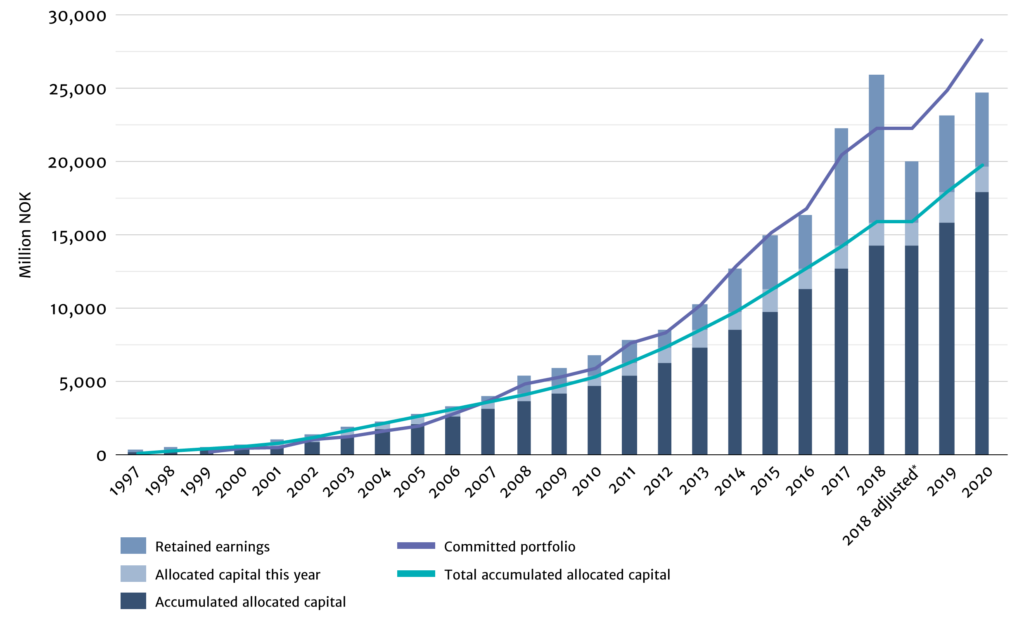
Committed investments per year (MNOK)
Jobs
in Norfund portfolio companies
Jobs created
new jobs created in portfolio companies
Female employees
in Norfund portfolio companies
New electricity capacity
New capacity financed in 2020, whereof 695 MW renewable
Electricity produced
Equivalent to the combined electricity consumption of Uganda, Tanzania and Kenya
CO2
avoided annually from new renewable capacity since inception/ 2020 portfolio
Investments and results - Clean Energy
New clients
Offered financial services in 2020
Total clients
Offered financial services in 2020
Increased lending
Increase in total lending volume (+11%)
Investments and results - Financial Institutions
IRR in 2020
in investment currency
-3.6% in NOK
IRR since inception
in investment currency
7.7% in NOK
More about IRR and financial results
Commitments per investment area
In 2020 (MNOK)
Total portfolio (MNOK)
Commitments per region
In 2020 (MNOK)
Total portfolio (MNOK)
Portfolio since inception
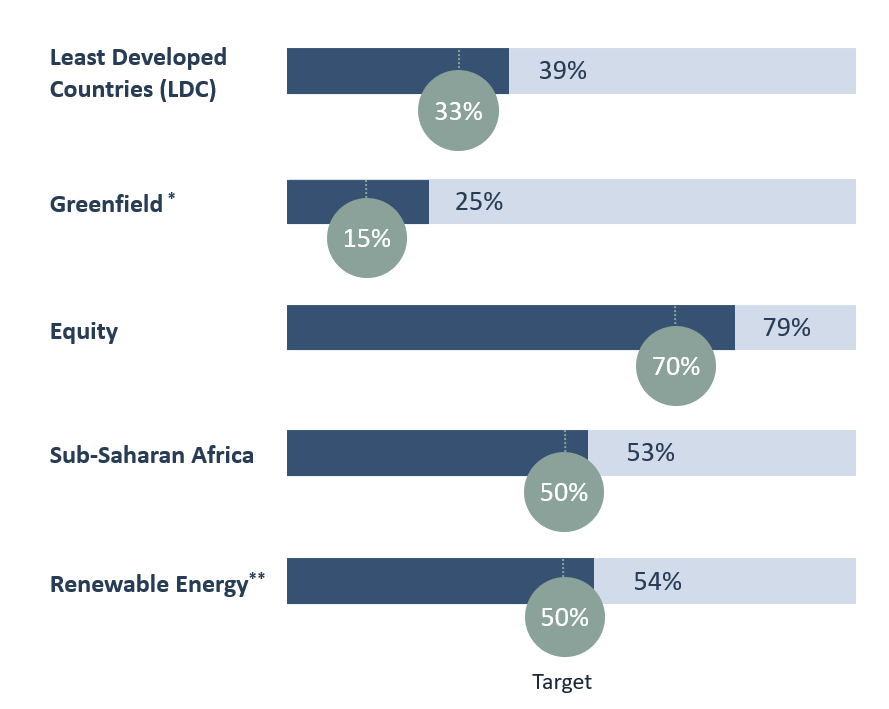
Norfund Key Performance Indicators
Five key performance indicators (KPIs) are developed as a tool to secure that the portfolio develops according to Norfund's mandate. The KPIs are all measured at the portfolio level, though also monitored year by year (see table below). As of 2020, Norfund delivers on all KPIs.
Gender Equality in Norfund, 2020
Key figures per year
| Key figures | 2015 | 2016 | 2017 | 2018 | 2019 | 2020 |
|---|---|---|---|---|---|---|
| Committed Portfolio (MNOK) | 15 127 | 16 762 | 20 439 | 22 253 | 24 944 | 28 352 |
| Return on invested capital (IRR) (inv. currency) | 3.5 % | 2.9 % | 14% | 4.6% | 6.3% | -0.1% |
| New investments (MNOK) | 2 395 | 2 784 | 3 600 | 3 511 | 4 015 | 4 839 |
| Number of direct investments in portfolio | 129 | 124 | 136 | 149 | 163 | 170 |
| Capital allocated by the owner (MNOK)* | 1 480 | 1 478 | 1 500 | 1 690 | 1 905 | 1 820 |
| KPI: Share of new investments in least developed countries | 38 % | 57 % | 34% | 47% | 36% | 31% |
| KPI: Share of new investments in Sub Saharan Africa | 85 % | 73 % | 35% | 49% | 61% | 48% |
| KPI: Share of greenfield investments | 18 % | 20 % | 38 % | 32% | 31% | 25% |
| KPI: Share of equity and indirect equity | 81 % | 67 % | 69 % | 67% | 64% | 57% |
| KPI: Renewable energy share of allocated capital | 22 % | 62 % | 133 % | 60 % | 55 % | 54% |
| Number of employees in Norfund | 69 | 69 | 71 | 75 | 82 | 96 |
| Number of jobs in portfolio companies | 382 000 | 276 000 | 292 000 | 304 000 | 380 000 | 377 000 |
| Taxes paid by portfolio companies (BNOK) | 8.6 | 10.9 | 9.3 | 13.9 | 14.1 | 16.1 |