Norfund creates the greatest development effects by ensuring that its capital is constantly deployed where it contributes most. We strive to be a patient, long-term investor that exits investments when we are no longer additional (needed) and others can take over.
When an investment is made, its duration and the exit strategy are planned at the same time. Typically, Norfund exits equity investments after 5-10 years, debt holdings after 5-7 years and fund investments after 10-12 years. However, investments might be exited earlier or later than planned due to unexpected circumstances.
Returns and dividends from investments, as well as sales proceeds following an exit are reinvested in new businesses in which there is a greater need for our capital.
Exit and post-exit analysis
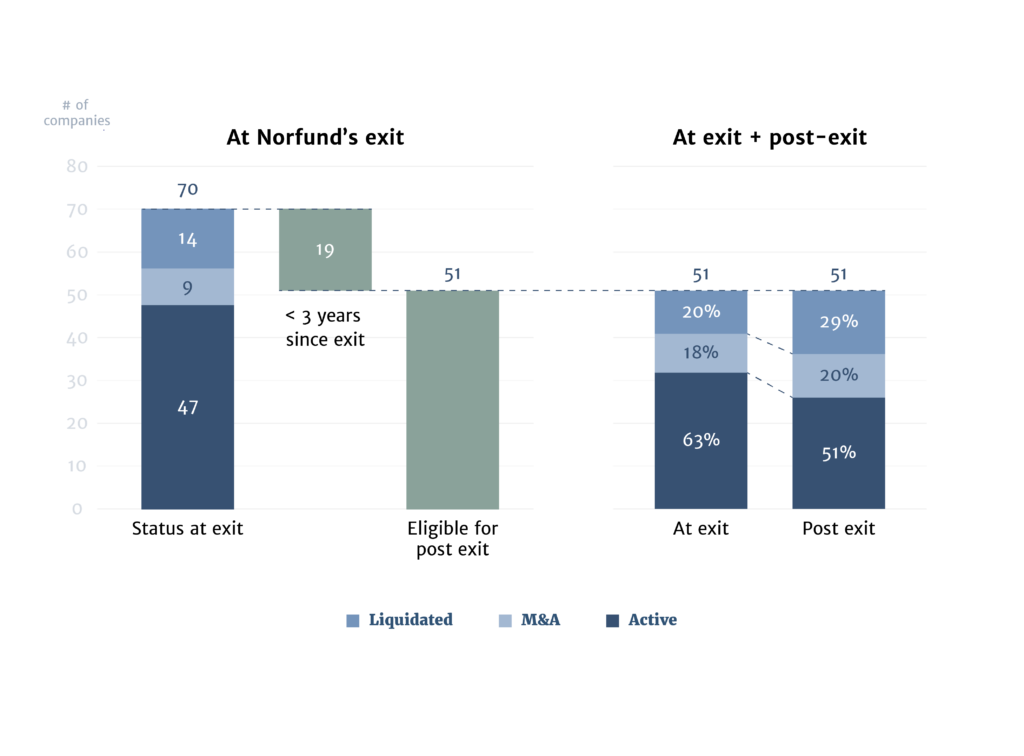
Contribute to creating sustainable companies that leave a lasting impact is at the core of Norfund’s mandate. At the same time, we are expected to take risk. At regular intervals we take stock and assess whether we succeed in delivering on our mandate and balance the two. The first exit analysis Norfund did was in 2015, followed by a 2019 analysis. In 2022 Norfund undertook an exit and post-exit analysis of 70 companies, with 51 of these qualifying for post-exit analysis as well.
In the exit analysis, companies are followed from time of investment, to exit, and to three years after Norfund’s exit (“post-exit”) to understand whether they survive, and if they thrive.
What is defined as an exit?
A project is considered exited when all Norfund’s instruments with the investee are exited and no direct or indirect relationship exists any longer.
What is post-exit?
The post-exit period is defined as three years after Norfund’s exit. The dataset consisted of 70 projects that have been exited to date. Of these, 51 are eligible for post-exit analysis – meaning more than three years have elapsed since Norfund exited the projects.
Limitations
- Dataset is not complete for all companies, and skewed towards large companies
- Different holding periods – and total figures are not weighted for holding period
- Loans are overrepresented in the dataset because they are self-exiting
- A liquidation is an automatic exit and may result in overrepresentation
- Fund investments are not included
- Data is not attributed to Norfund’s contribution
Key results
At the time of exit:
- 80% of companies were active (in original form or merged)
- 20% of companies were liquidated during Norfund’s holding period
- Equity investments had a higher share liquidated companies than loans
Three years post-exit:
- 87% of the companies that were active at Norfund’s exit were still active
- All companies that Norfund had exited at fair price were still active
- 75% of companies where Norfund had taken a write-off or write-down at exit, were liquidated
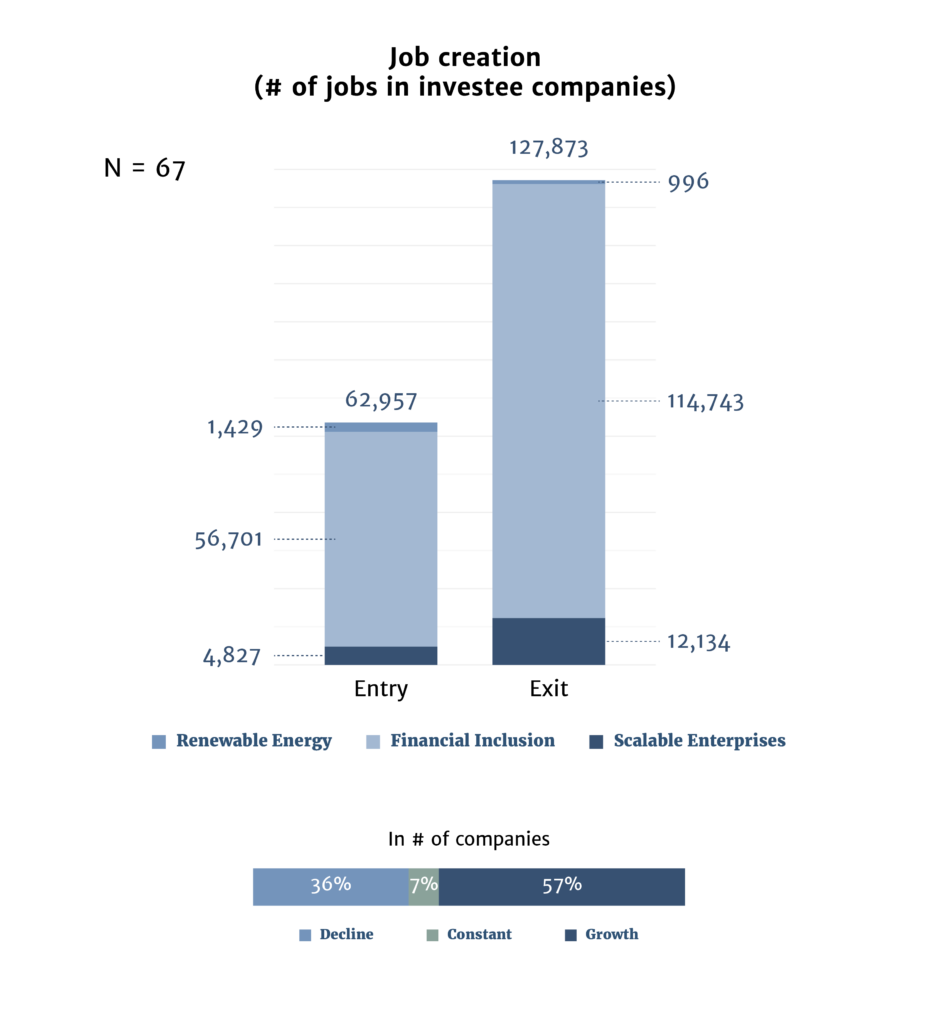
Job creation in exited portfolio companies *
- Just over half of the companies saw an increase in the number of jobs from entry to exit
- In total, there is a near doubling in number of jobs from entry to exit, mainly driven by a few large financial institutions
- From exit to post exit, more than half the companies continue to see an increase in jobs, albeit at a significantly lower rate
- Companies with a decline in jobs post exit are a combination of renewable energy investments (to be expected as they move from construction to operation), financial institutions, and companies liquidated
*with available data at entry and exit
Moreover, the analysis looked at taxes paid, turnover, and net income – all with average annual growth (CAGR) of 17-20%, both during Norfund ownership as well as post-exit.
Financial return
- Positive IRR seems to be correlated with higher job growth both during Norfund ownership and post Norfund exit
Exited companies 2022
ACLEDA Bank Lao Ltd.
- Region: Asia
- Sector: Financial Inclusion
- First investment year: 2014
- Investment: 141.9 MNOK
- IRR: 10%
Aureos Latin America Fund
- Region: Latin America
- Sector: SME Funds
- First investment year: 2007
- Investment: 183.1 MNOK
- IRR: 5.3%
Bronkhorstspruit Biogas Plant
- Region: Africa
- Sector: Renewable Energy
- First investment year: 2011
- Investment: 26.3 MNOK
- IRR: -11.4%
Fanisi Venture Management Company
- Region: Africa
- Sector: SME Funds
- First investment year: 2009
- Investment: 0.9 MNOK
- IRR: -100%
New Africa Power
- Region: Africa
- Sector: Renewable Energy
- First investment year: 2017
- Investment: 8.7 MNOK
- IRR: N/A
Starsight
- Region: Africa
- Sector: Renewable Energy
- First investment year: 2019
- Investment: 54.4 MNOK
- IRR: 11.63%