For the first time this year, Norfund reports on both the Development Mandate and the new Climate Mandate, as the Climate Investment Fund became operational starting in 2022. For some key figures such as commitments and investments we present both here, while on others such as certain development effects we report only on the Development Mandate due to the current relatively small size of the Climate Mandate.
For more detailed reporting on each mandate refer to their individual sections in the content menu above.
New commitments
Development Mandate
billion NOK in 2022*
*Excluding Business Support and PDRMF
Climate Mandate
billion NOK in 2022
Total commitments
Development Mandate
billion NOK in portfolio
Climate Mandate
billion NOK in portfolio
Investments
Development Mandate
New/follow-on investments in 2022
Climate Mandate
New investments in 2022
Companies
Development Mandate
total direct/indirect investees in the portfolio
Climate Mandate
total direct investees in the portfolio
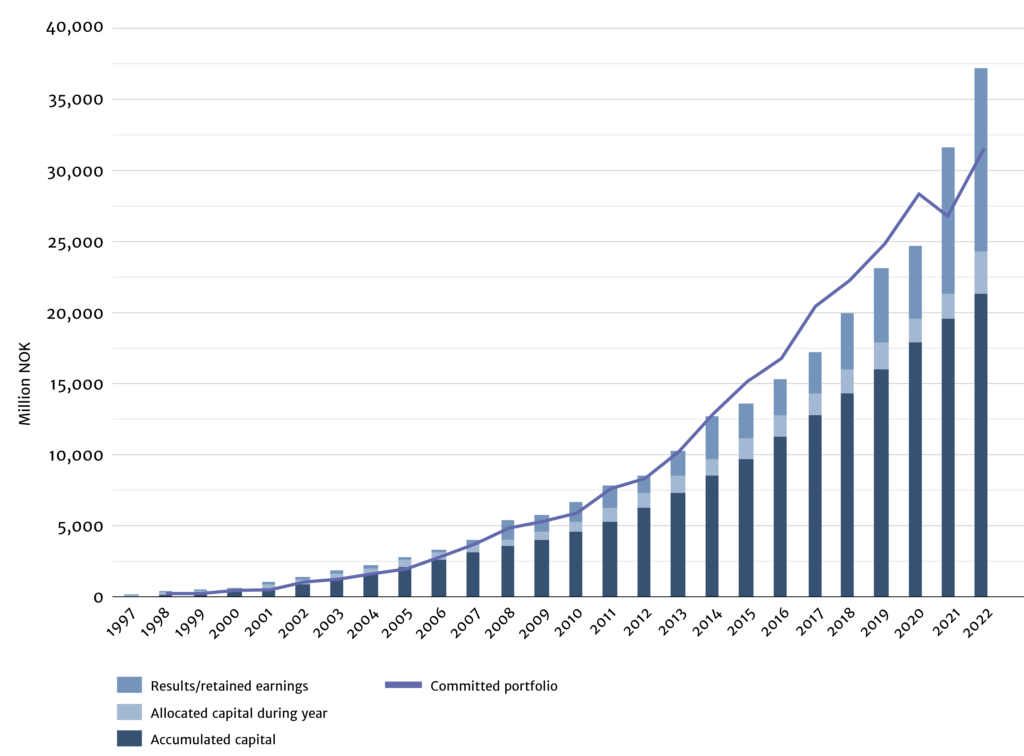
Committed investments per year (MNOK)
Jobs
in Norfund portfolio companies under Development Mandate
Jobs created
new jobs created (net) in portfolio companies under Development Mandate
Female employees
in Norfund portfolio companies under Development Mandate, a 10% net increase
New electricity capacity
Development Mandate
financed in 2022
Climate Mandate
financed in 2022
Development Mandate
electricity produced
Almost equivalent to the combined annual electricity consumption of Kenya, Tanzania, and Uganda
CO2
Development Mandate
Avoided annually from new renewable capacity since inception/2022 portfolio
Climate Mandate
Expected avoided emissions*
*Based on financed capacity and expected production, the expected avoided emissions are calculated to be 6.2mill tCO2e per year.
New clients
offered financial services in 2022
under the Development Mandate
Total clients
offered financial services in 2022
under the Development Mandate
Increased lending
increase in total lending volume
under the Development Mandate
IRR in 2022
in investment currency
14.8% in NOK
IRR since inception
in investment currency
8.1% in NOK
The IRR in 2022 is only calculated with Development Mandate investments included.
(The IRR for 2022 and since inception are both 5.1%, and is not a typo.)
Commitments per investment area
Total portfolio (MNOK)
In 2022 (MNOK)
Commitments per region
Total portfolio (MNOK)
In 2022 (MNOK)
Portfolio since inception
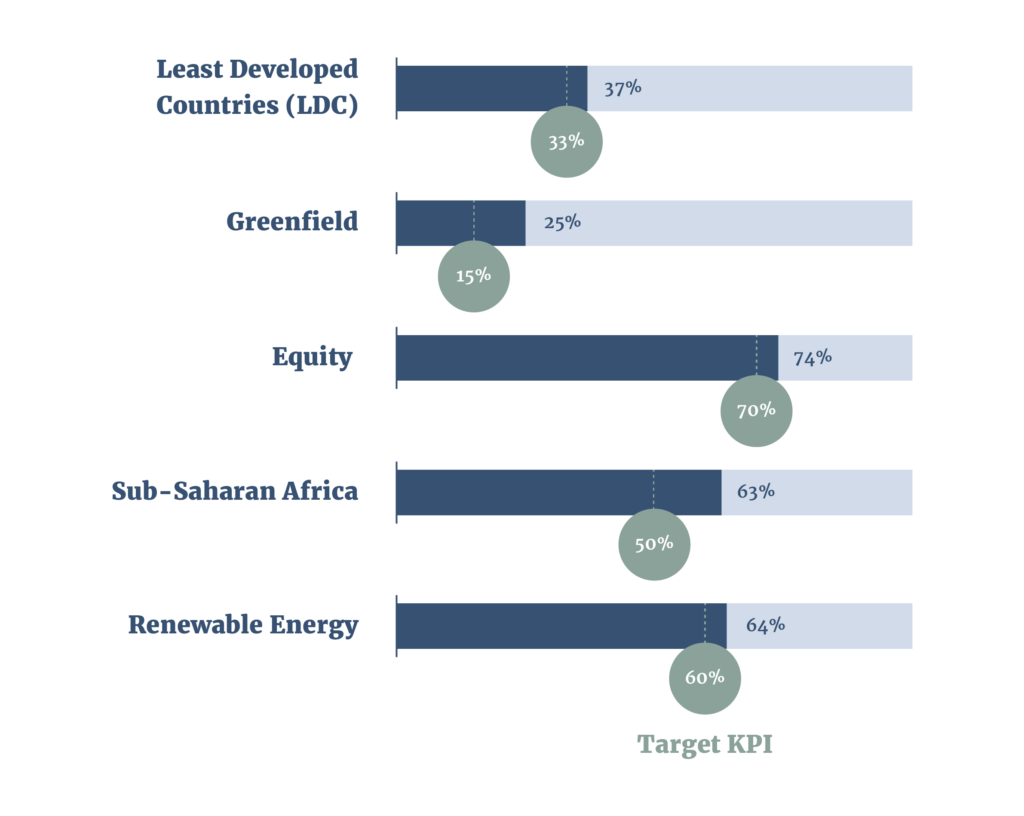
Norfund Key Performance Indicators (Development Mandate)
Five key performance indicators (KPIs) are developed as a tool to secure that the portfolio develops according to Norfund's mandate. The KPIs are all measured at the portfolio level, though also monitored year by year (see table below).
Gender equality in Norfund's investees 2022
Gender equality in Norfund 2022
Key figures per year
| Key figures | 2016 | 2017 | 2018 | 2019 | 2020 | 2021 | 2022 |
|---|---|---|---|---|---|---|---|
| Climate and Development Mandates | |||||||
| Committed portfolio (MNOK) | 16 762 | 20 439 | 22 253 | 24 944 | 28 352 | 26 924 | 31 650 |
| New investments (MNOK) | 2 784 | 3 600 | 3 511 | 4 015 | 4 839 | 5 320 | 6 513 |
| Number of direct investments in portfolio | 124 | 136 | 149 | 163 | 170 | 195 | 226 |
| Capital allocated by the owner (MNOK) | 1 478 | 1 500 | 1 690 | 1 905 | 1 820 | 1 680 | 2680 |
| Number of employees in Norfund | 69 | 71 | 75 | 82 | 96 | 111 | 113 |
| Development Mandate | |||||||
| Committed portfolio (MNOK) | 16 762 | 20 439 | 22 253 | 24 944 | 28 352 | 26 924 | 29 516 |
| New investments (MNOK) | 2 784 | 3 600 | 3 511 | 4 015 | 4 839 | 5 320 | 4 540 |
| Return on invested capital (IRR) (inv. currency)* | 2.9% | 14% | 4.6% | 6.3% | -0.1% | 5.2% | 5.1% |
| Number of direct investments in portfolio | 124 | 136 | 149 | 163 | 170 | 195 | 219 |
| KPI: Share of investments in least developed countries | 33% | 36% | 41% | 40% | 39% | 40% | 37% |
| KPI: Share of investments in Sub Saharan Africa | 52% | 50% | 55% | 53% | 53% | 65% | 63% |
| KPI: Share of greenfield investments | 20% | 27% | 32% | 31% | 25% | 22% | 25% |
| KPI: Share of equity and indirect equity | 85% | 85% | 81% | 79% | 79% | 75% | 74% |
| KPI: Renewable energy share of allocated capital >50% (ended 2021) | 62% | 145% | 60% | 55% | 54% | 40% | - |
| KPI: Renewable energy share of allocated capital >60% | 64% | ||||||
| Number of jobs in portfolio companies | 276 000 | 292 000 | 304 000 | 380 000 | 377 000 | 452 000 | 514 000 |
| Taxes paid by portfolio companies (BNOK) | 10.9 | 9.3 | 13.9 | 14.1 | 16.9 | 16.9 | 23.2 |
| Climate Mandate | |||||||
| Committed portfolio (MNOK) | - | - | - | - | - | - | 2 135 |
| New investments (MNOK) | - | - | - | - | - | - | 2135 |
| Number of direct investments in portfolio | - | - | - | - | - | - | 7 |
*The IRR reported for 2021 has been updated due to information received after the reporting period.