Key figures
While the full impact of Norfund’s investments is impossible to quantify, we work to measure the development effects our portfolio companies generate. Below you’ll find a collection of our most important figures.
For a complete overview of Norfund’s 2025 figures, see our annual report ->
Commitments
8.4 billion
new commitments (NOK)
45.5 billion
total portfolio (NOK)
More about our financial results->
Mobilisation and costs
17.8 billion
mobilised private capital (NOK)
attributed according to OECD Methodology (preliminary estimation)
1.16 %
operating cost
of committed portfolio
Investments
34
new investments
in 2025
24
follow-ons
in 2025
267
direct investees
in our portfolio
1,114
indirect investees
in our portfolio
Jobs
788,000
total jobs
in portfolio companies
29,000
jobs created in 2025, net
in portfolio companies
40 %
female employees
in portfolio companies
More about job creation in Norfund’s portfolio companies ->
Energy access and supply
1,6 million
new households
granted access to electricity in 2025
25.3 TWh
electricity produced
by portfolio companies in 2025
12,3 GW
new capacity
total new renewable capacity financed in 2025
More about energy access and supply ->
Access to finance
12.7 million
new clients
offered financial services in 2025
158million
total clients
offered financial services in 2025
87.3 billion
increase in lending volume
(NOK)
More about access to finance ->
Avoided emissions
10.3 million
tCO₂e actual avoided emissions
by greenfield assets in 2025
22.7 million
expected tCO₂e
avoided emissions annually from 2025 investments (Climate Investment Fund)
Read more about avoided emissions ->
Taxes
41 billion
taxes paid in 2025 (NOK)
4.2 billion
increase in taxes paid by portfolio companies (NOK)
Read more about tax revenues ->
IRR
Internal rate of return
7.8 %
in 2025, across mandates
in investment currency
5.3 %
since inception, across mandates
in investment currency
13.3 %
since inception, Climate Investment Fund
in investment currency
5.2 %
since inception, Development Mandate
in investment currency
Read more about our financial returns in 2025 ->
Read more about our financial results in general ->
Portfolio breakdown in 2025
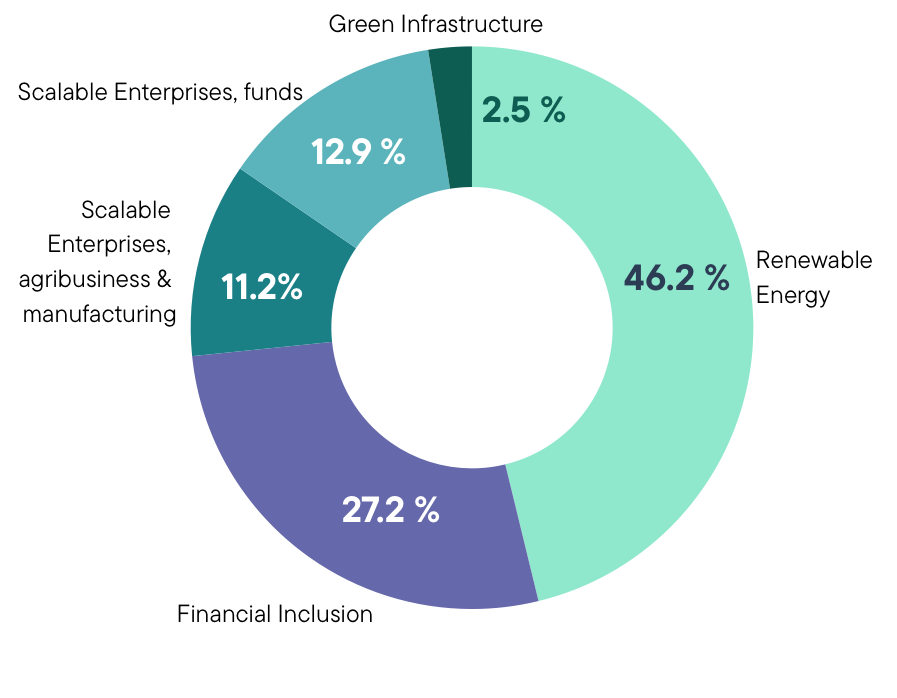
New commitments per investment area
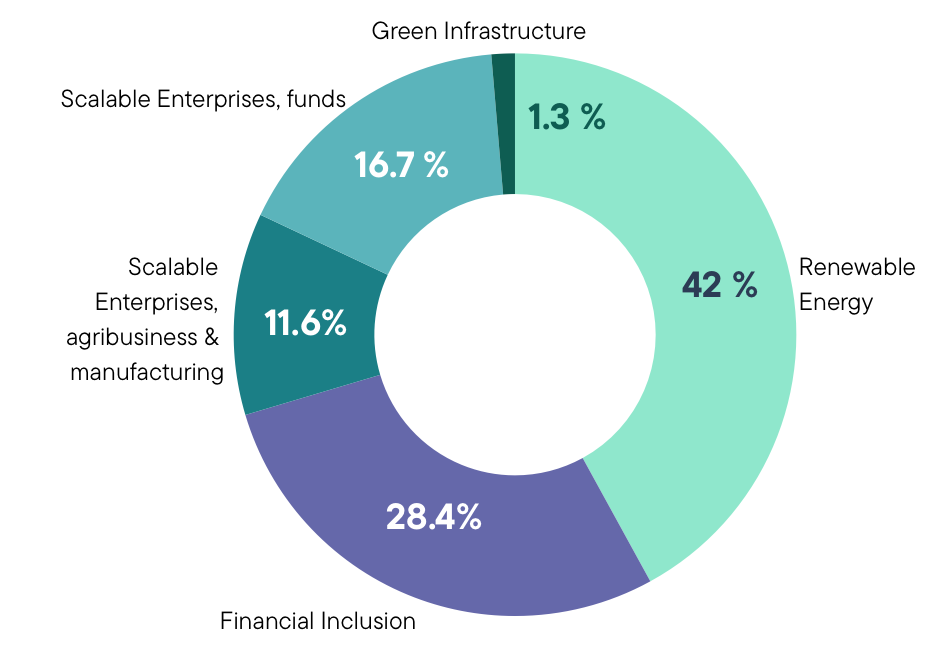
Portfolio per investment area
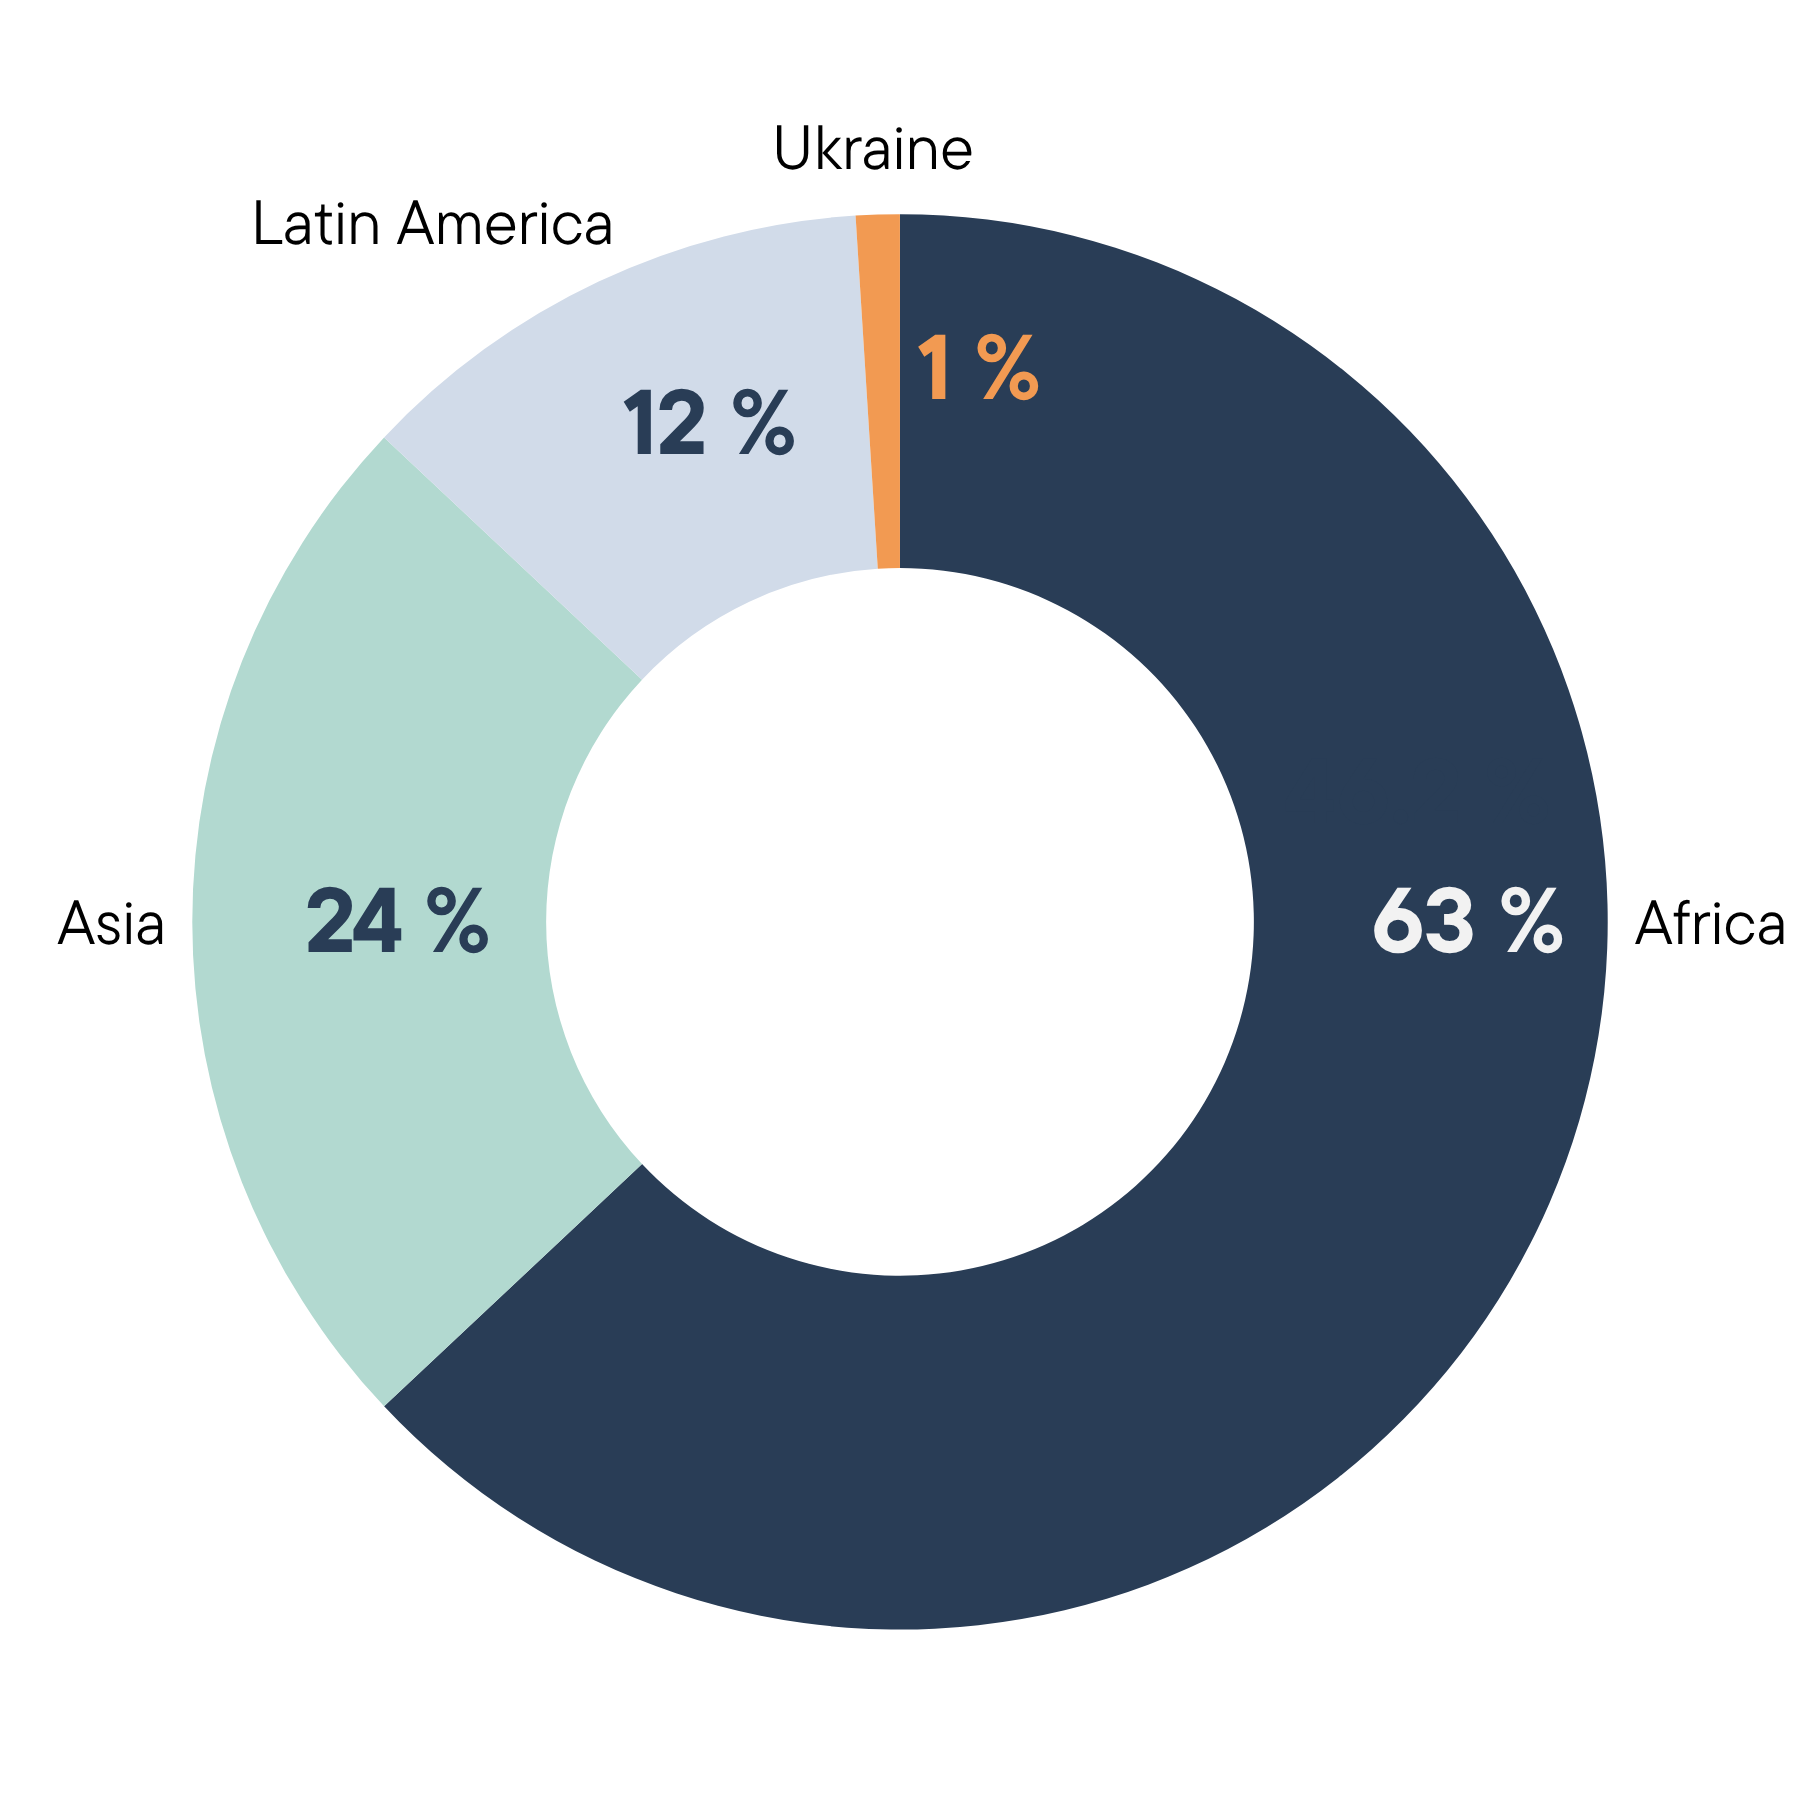
New commitments per region
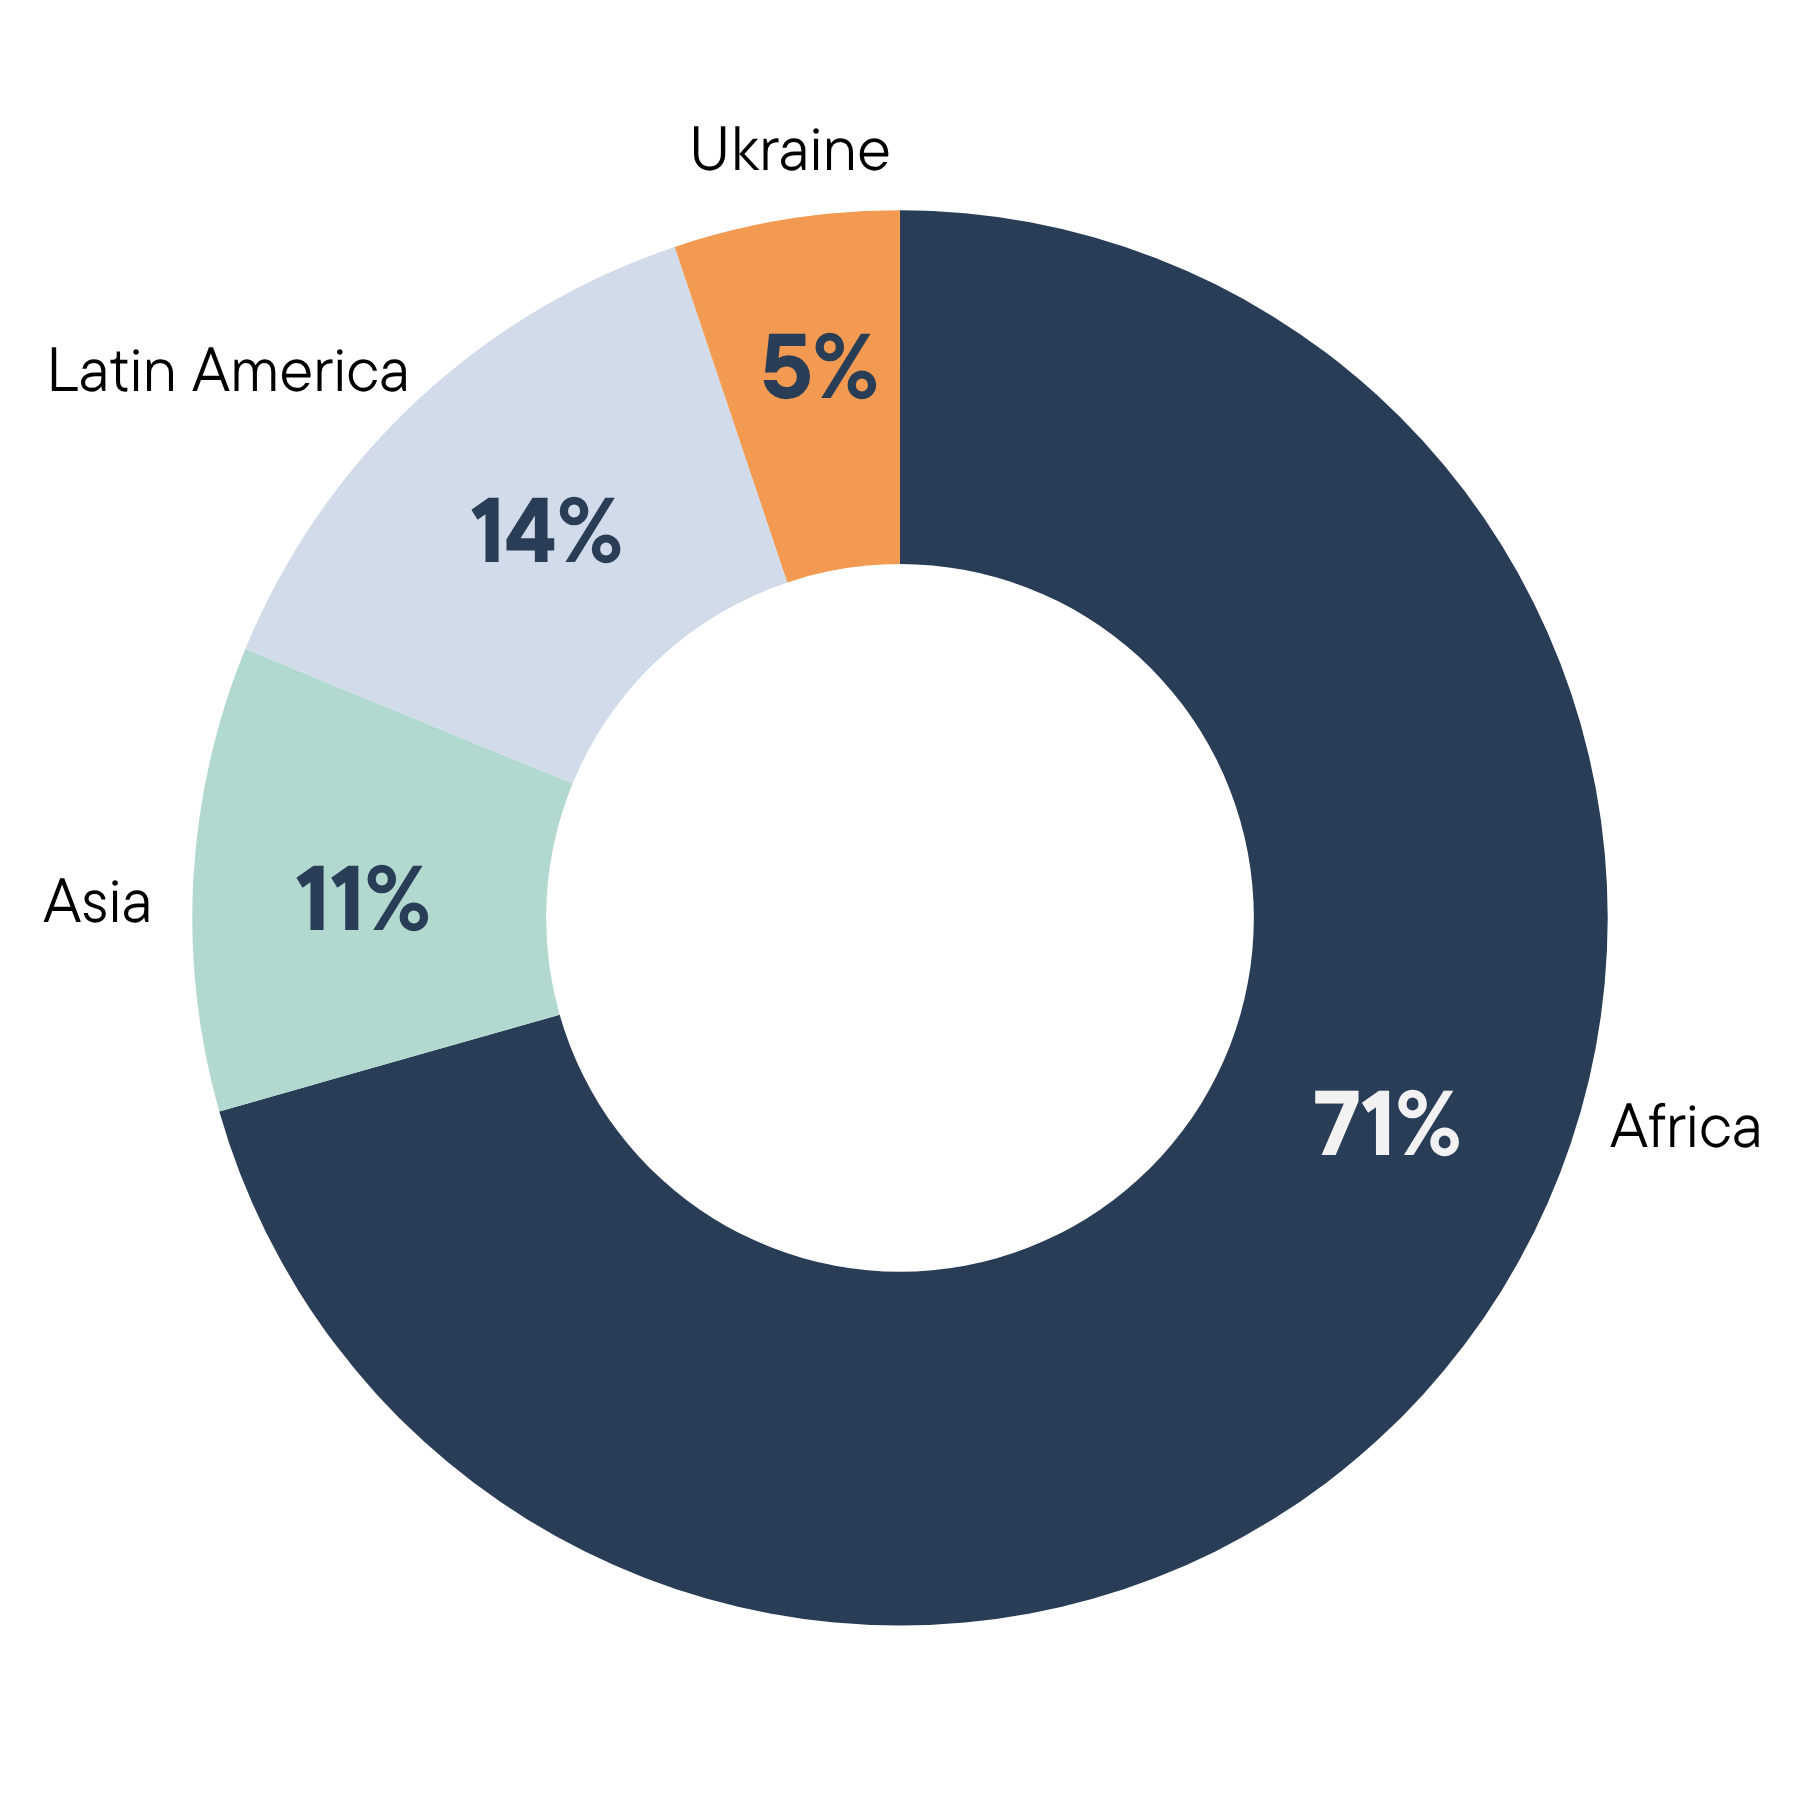
Portfolio per region
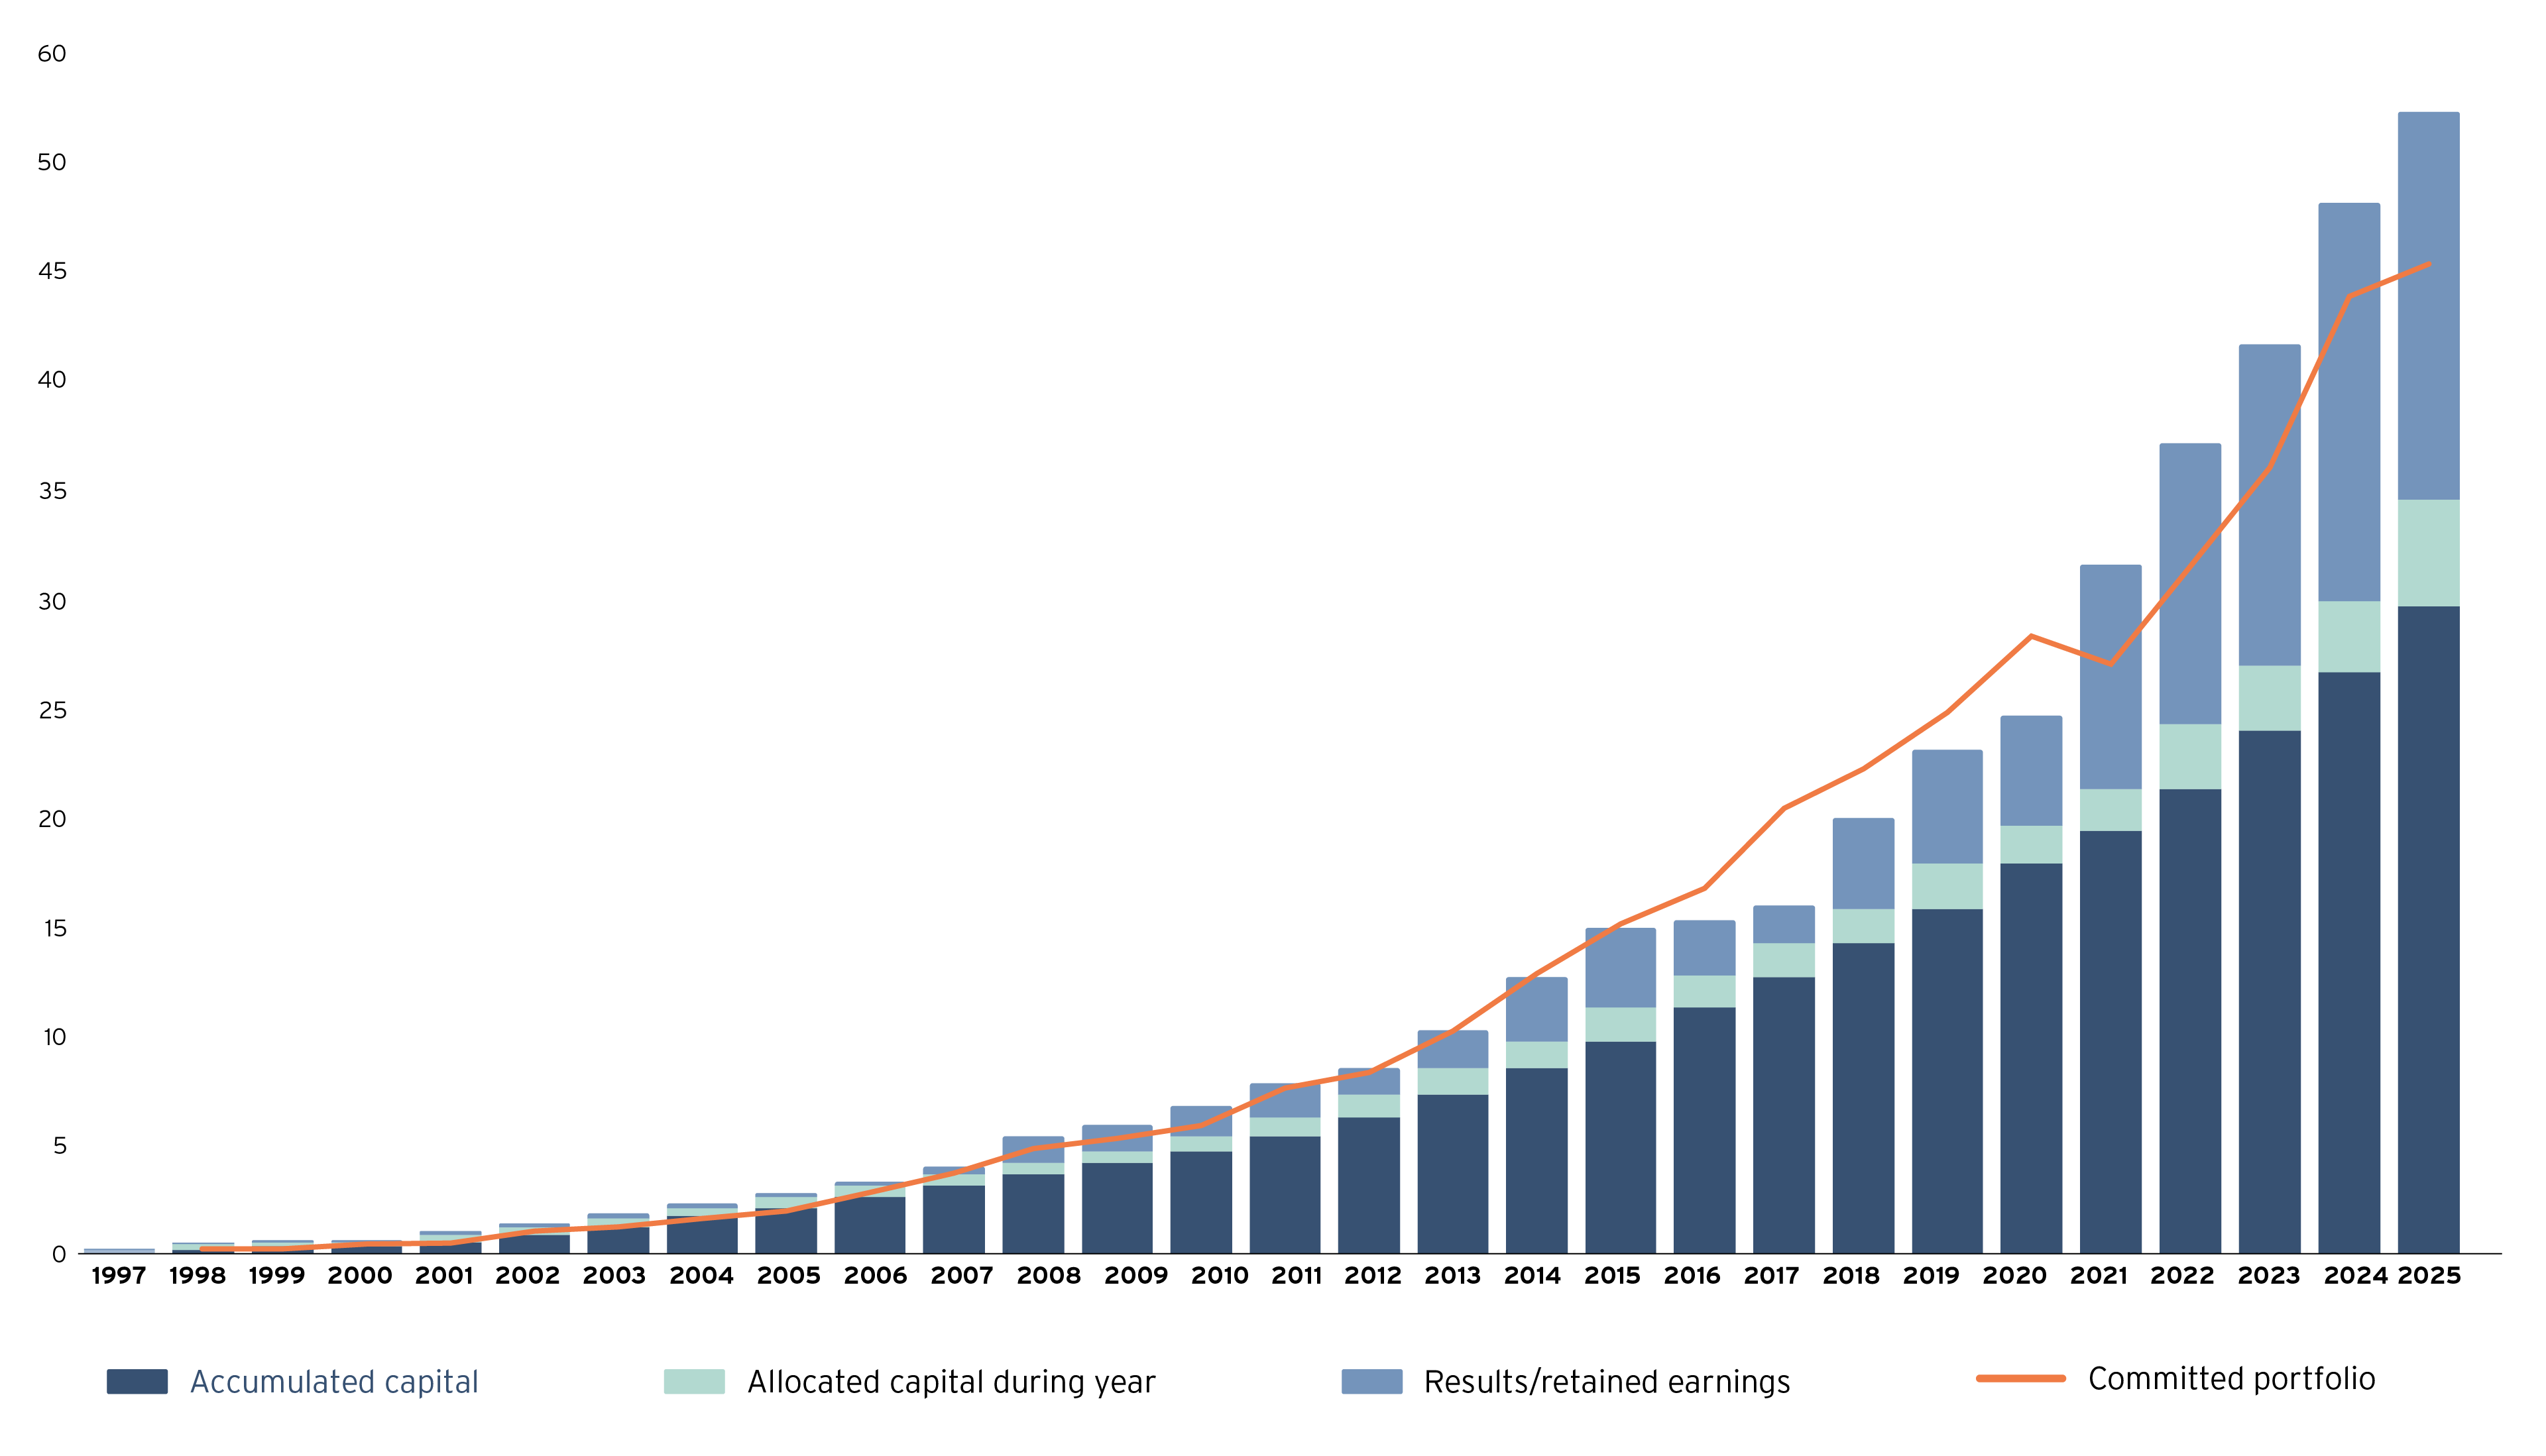
Portfolio since inception, billion NOK
Key Performance Indicators
Development mandate
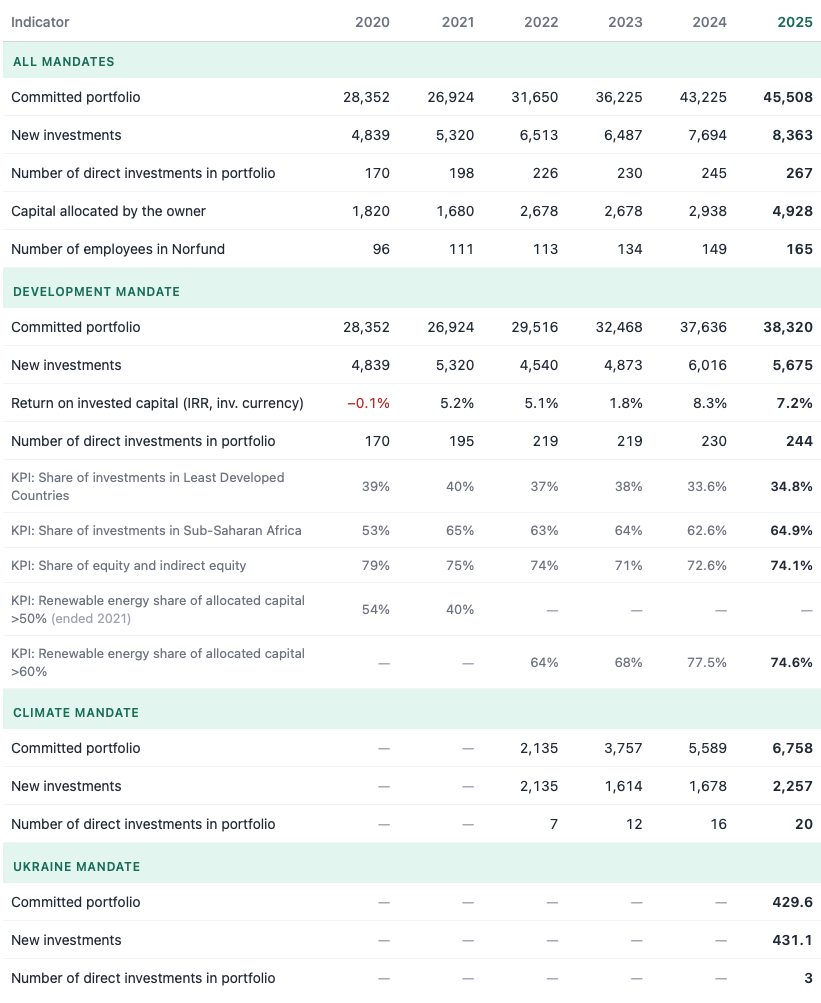
Four key performance indicators (KPIs) have been developed for the Development mandate (see table below):
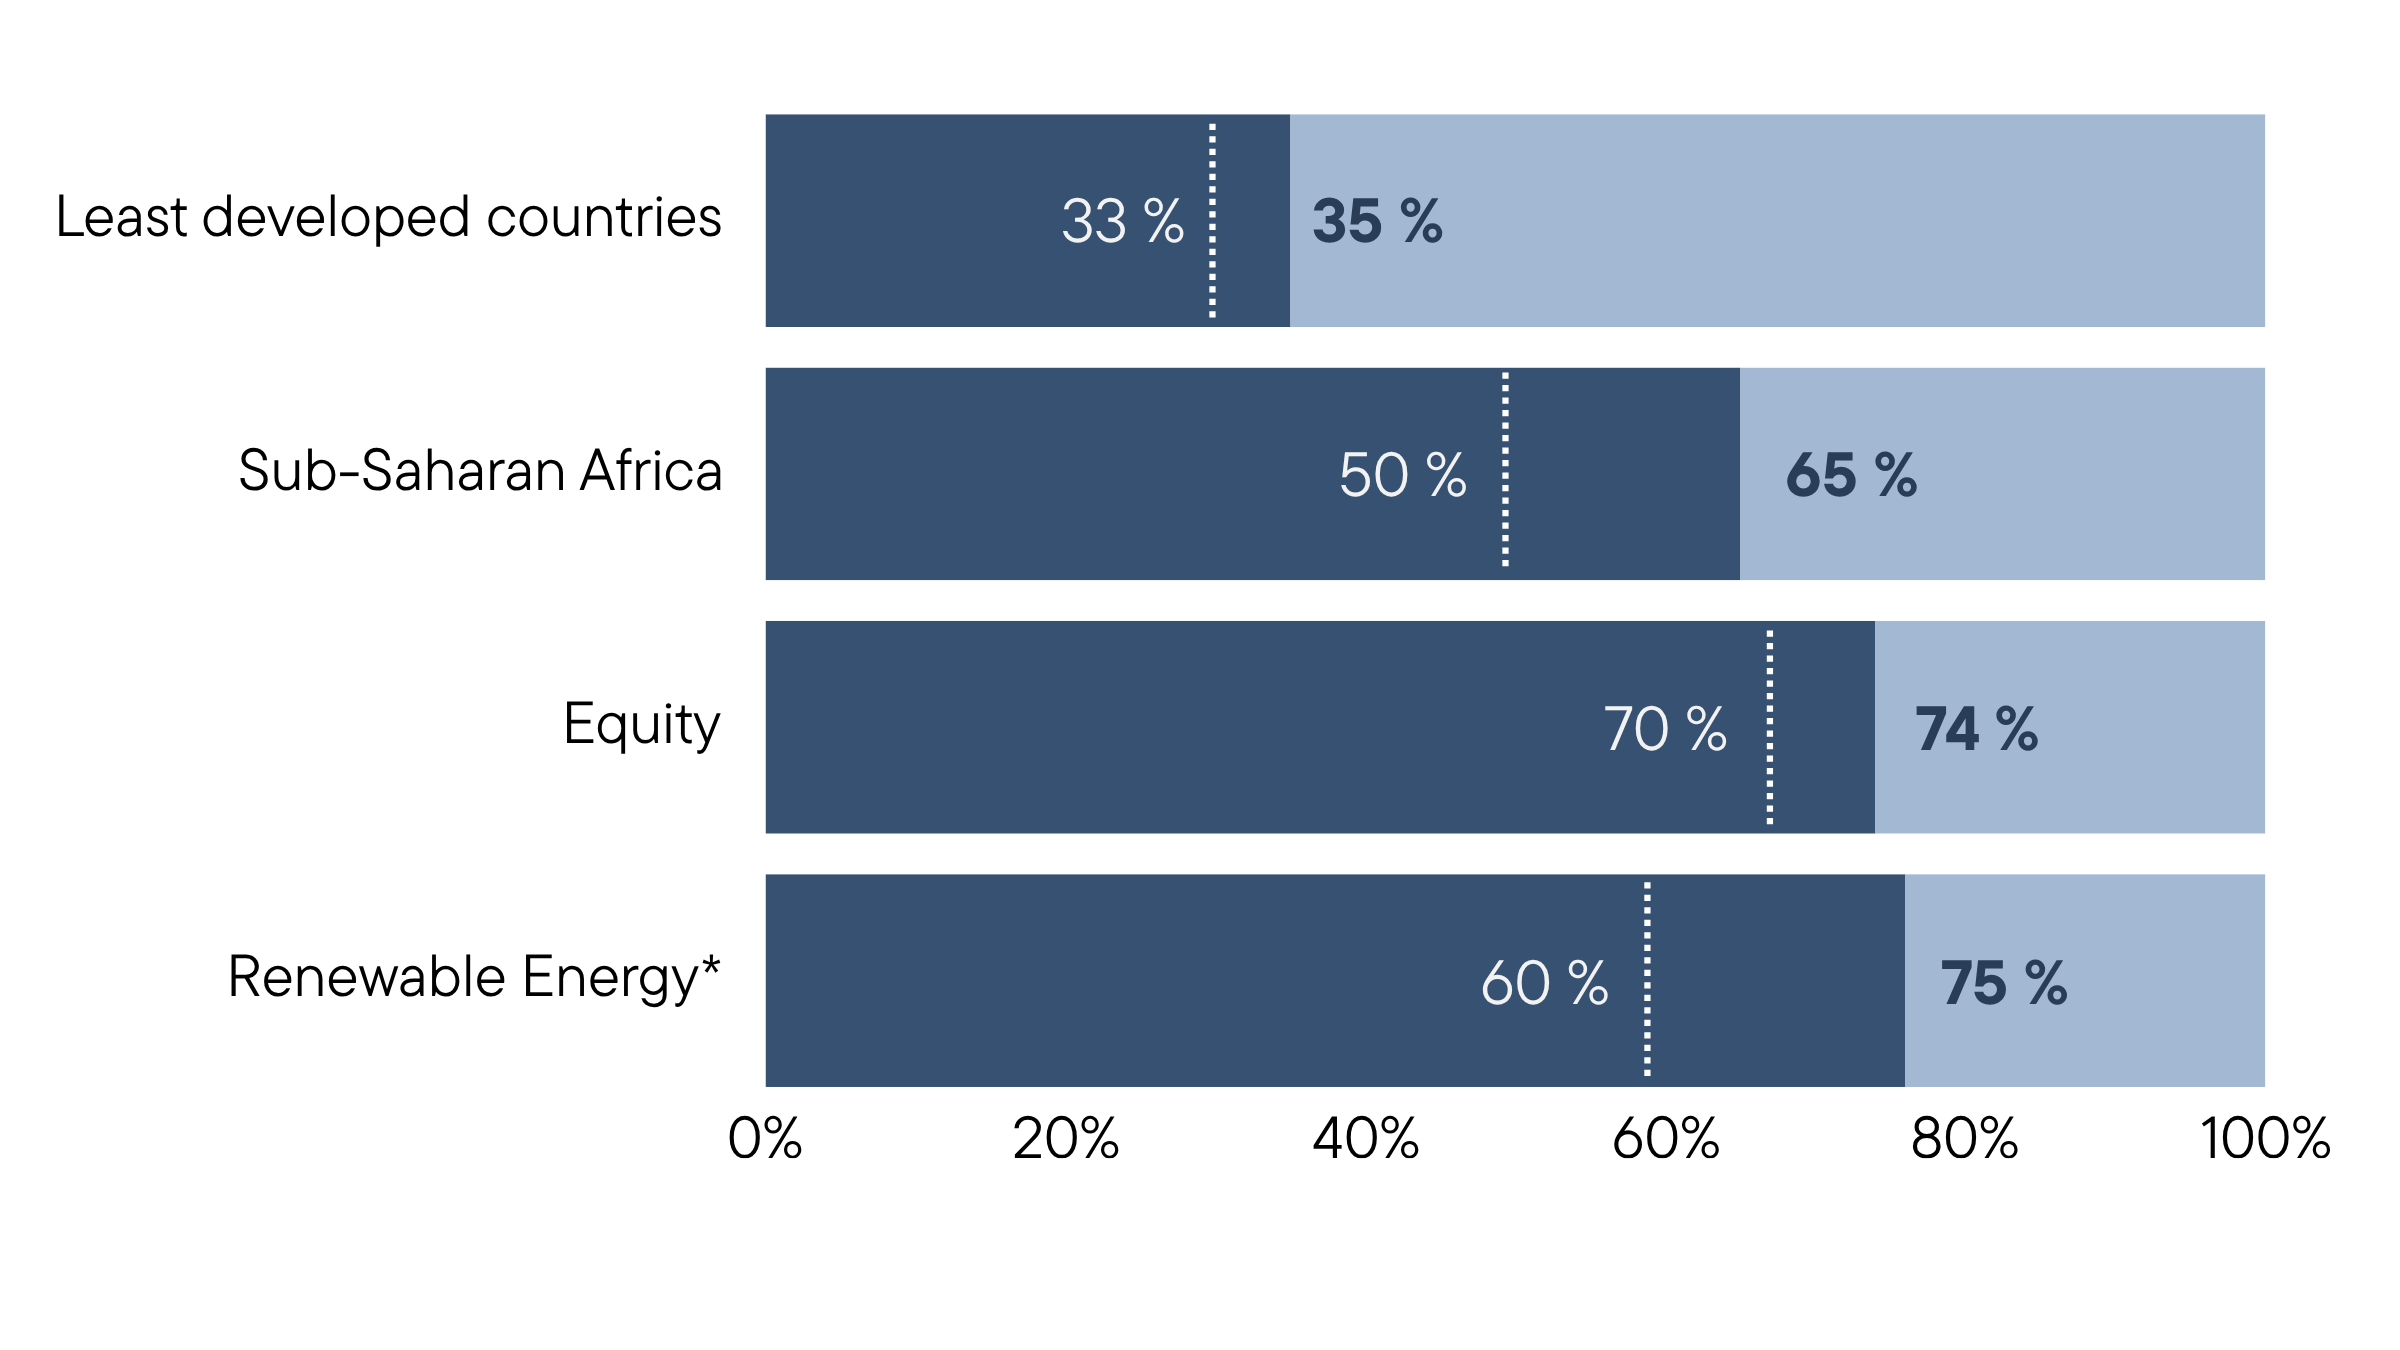
*The RE KPI was new for 2022 and is different from the other portfolio KPI’s. The RE KPI is defined as total RE-commitments (at commitment date fx-rate) divided by total allocation from MFA, starting from 2022. This should over time be at least 60%.
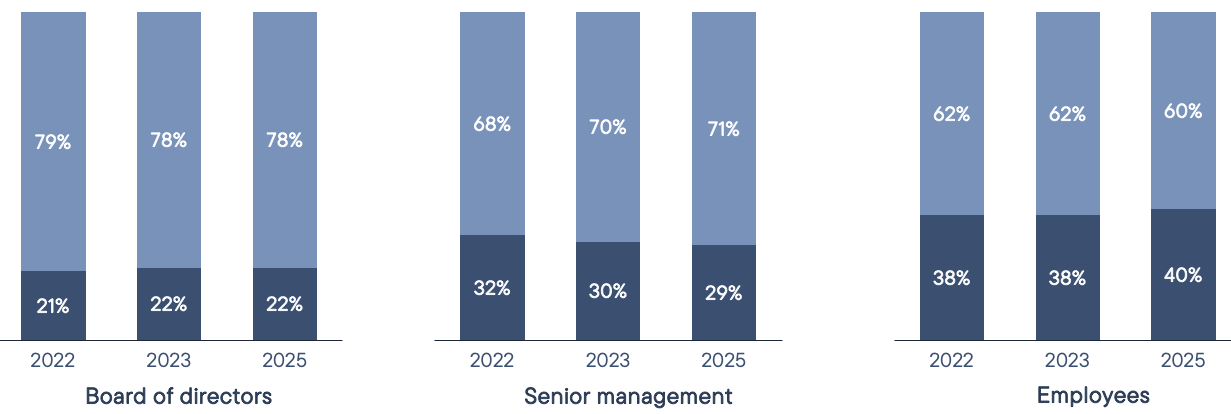
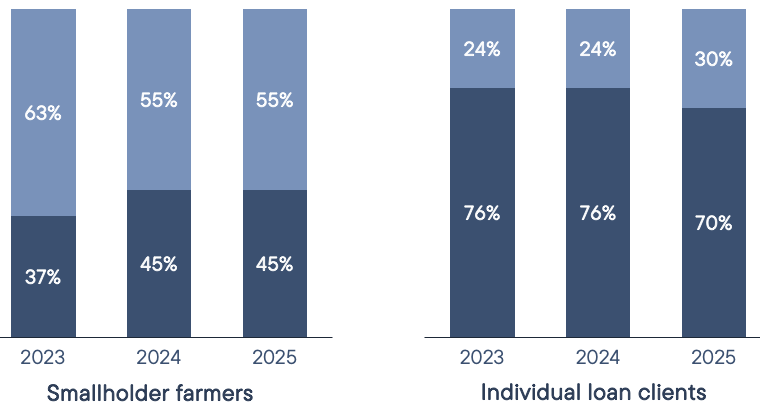
Gender balance in Norfund’s portfolio companies
Status 2023-2025

Read more about our work with gender equality ->
Key figures per year